Measuring Product-market fit – Retention rates and cohort analysis
As we explored in the previous post, startups don’t fail because they lack ideas. They fail because they miss product–market fit. PMF is the proof that your product truly delivers value, and measuring it means looking beyond guesses or gut feeling.

Quantitative methods reveal the hard evidence. Instead of asking users what they think, you track what they do: how many return, how long they stay, and whether new features improve or weaken engagement. With metrics and analyses like retention rates, retention curves, and cohort analysis, you can see your product’s traction in real time and know if you’re building on solid ground.
For managing these analyses, you can use free or affordable tools like Mixpanel, Amplitude, Google Analytics or similar. These tools can track retention, run cohort analyses, and help you measure PMF effectively without breaking the bank.
Understanding retention rates and using cohort analysis can give you a deeper, ongoing perspective on PMF. Here’s what you get with them.
Retention rates and the retention curve
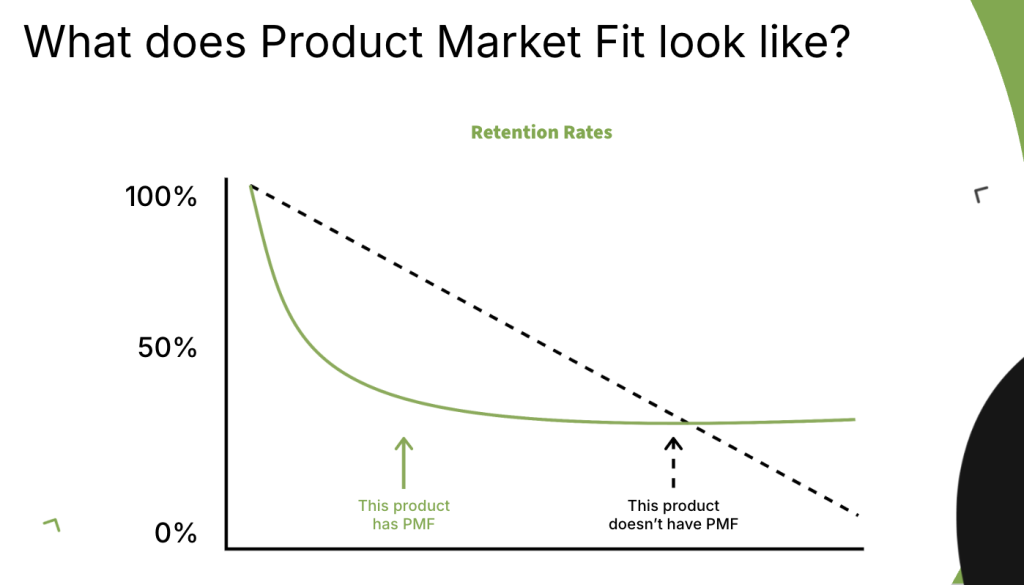
A key sign of PMF is a flattening retention curve. Retention curve analysis measures the percentage of users who continue to use your product over time. If, after a few months, you see your retention curve level out – meaning a core group of users sticks around long-term – you’ve likely found your product’s “sticky factor.”

Cohort analysis: Tracking growth by group
Cohort analysis takes retention a step further by grouping users based on when they started using your product (e.g., January users, February users) and tracking each group’s retention over time. This approach lets you see how changes in your product impact user engagement for each group, highlighting how your product’s PMF is evolving.
For instance:
Let’s say January users have a retention rate that flattens after three months, while February users flatten earlier, after two months. This positive trend suggests that recent product adjustments improved retention and PMF.
Alternatively, if later cohorts have weaker retention than earlier ones, it may be time to revisit your product’s core value and the onboarding experience.
Cohort analysis is incredibly valuable for understanding if you’re progressing towards PMF or if recent changes are inadvertently moving you away from it.
Holycode’s insights to retention
At Holycode, we’ve seen how retention-driven PMF efforts directly impact startup success. In fact, 95% of our clients are still active today because a lot of them nailed PMF by continuously improving their user engagement and retention. With strong PMF, startups don’t just survive – they thrive.
Final thoughts: Measuring PMF is just the beginning
Finding PMF isn’t a one-time achievement. As the market shifts, so will your PMF markers, which is why ongoing listening, measuring, and adapting is crucial. Retention rates and cohort analysis, combined with the Sean Ellis survey, give you a comprehensive toolkit to understand and strengthen your product’s fit.
My advice? Start measuring as soon as possible to get it right!
Let’s make sure your PMF strategy is set for success. Let’s take the next steps together!
Let’s start achieving excellence together
Get in touch with our experts today to turn your ideas into reality and accelerate business growth.


